- What, why
- Time - where, how often
- Memory - how much, of what type
- Web frameworks
Profiling in Python
Asim Ihsan
(use arrow keys or space bar to advance, 'O' for overview)
Contents
Contents
- What, why
- Time - where, how often
- Memory - how much, of what type
- Web frameworks
What, why
- Want to know what a programme is doing
- Debugging
- Optimisation
- Deterministic vs. statistical profiling
Contents
- What, why
- Time - where, how often
- Memory - how much, of what type
- Web frameworks
Time
-
cProfileis a great built-in deterministic profiler.- deterministic \(\Rightarrow\) comprehensive; observer effect!
-
kcachegrindis the most user-friendly way to explore call graphs. -
line_profilerhas even higher overhead, but allows you line-by-line insight.
Our code example - log parsing
Input: bzip-compressed log file.
Format:
epoch,metric,value1362331306,cpu_usage,74 1362331307,memory_usage,1396 1362331308,cpu_usage,13 ...
Output: arithmetic mean of CPU usage.
- Metric =
cpu_usage
- Metric =
Code caveat
- This purpose of this code is not "how do I parse this log file the fastest?".
- The code that follows is deliberately obtuse and non-idiomatic.
re_log_line = re.compile("(.*?),(.*?),(.*)\n")

def main():
    cpu_usages = []
    with contextlib.closing(bz2.BZ2File(log_filepath)) as f_in:
        for line in f_in:
            process_line(line, cpu_usages)
    summarise(cpu_usages)

def summarise(cpu_usages):
    print "avg: %s" % (sum(cpu_usages) / len(cpu_usages), )

def process_line(line, cpu_usages):
    re_obj = re_log_line.search(line)
    try:
        elems = re_obj.groups()
    except:
        pass
    else:
        if elems[1] == "cpu_usage":
            cpu_usages.append(int(elems[2]))
cProfile from CLI
python -m cProfile -o profile.stats parse_log.py
- Outputs
profile.statsto current directory. - Can get a list of "hot functions" quite easily:
python -c "import pstats; p = pstats.Stats('profile.stats'); p.sort_stats('time').print_stats(5)"

   ncalls  tottime  percall  cumtime  percall filename:lineno(function)
  5000000   12.930    0.000   23.044    0.000 cpu_profiling/parse_log.py:31(process_line)
        1    8.666    8.666   31.756   31.756 cpu_profiling/parse_log.py:21(main)
  5000000    7.917    0.000    7.917    0.000 {method 'search' of '_sre.SRE_Pattern' objects}
  5000000    1.621    0.000    1.621    0.000 {method 'groups' of '_sre.SRE_Match' objects}
  5000065    0.575    0.000    0.575    0.000 {method 'append' of 'list' objects}
- Program took 31.756s to run.
-
tottime: total time spent in function excluding calls to subfunctions. -
cumtime: total time spent in function including calls to subfunctions. - Note the obvious for
main, thatcumtime = percallandncalls = 1. - Top three functions take \(\frac{12.930+8.666+7.917}{31.756} \times 100 = 92.9\%\) of time.
   ncalls  tottime  percall  cumtime  percall filename:lineno(function)
  5000000   12.930    0.000   23.044    0.000 cpu_profiling/parse_log.py:31(process_line)
  5000000    7.917    0.000    7.917    0.000 {method 'search' of '_sre.SRE_Pattern' objects}
  5000000    1.621    0.000    1.621    0.000 {method 'groups' of '_sre.SRE_Match' objects}
  5000065    0.575    0.000    0.575    0.000 {method 'append' of 'list' objects}

def process_line(line, cpu_usages):
    re_obj = re_log_line.search(line)
    try:
        elems = re_obj.groups()
    except:
        pass
    else:
        if elems[1] == "cpu_usage":
            cpu_usages.append(int(elems[2]))
-
process_linetakes \(\frac{12.930}{31.756} \times 100 = 40.7\%\) of the time excluding calls to subfunctions.
   ncalls  tottime  percall  cumtime  percall filename:lineno(function)
        1    8.666    8.666   31.756   31.756 cpu_profiling/parse_log.py:21(main)

def main():
    cpu_usages = []
    with contextlib.closing(bz2.BZ2File(log_filepath)) as f_in:
        for line in f_in:
            process_line(line, cpu_usages)
    summarise(cpu_usages)
-
maintakes \(\frac{8.666}{31.756} \times 100 = 27.3\%\) of time, excluding calls to subfunctions.
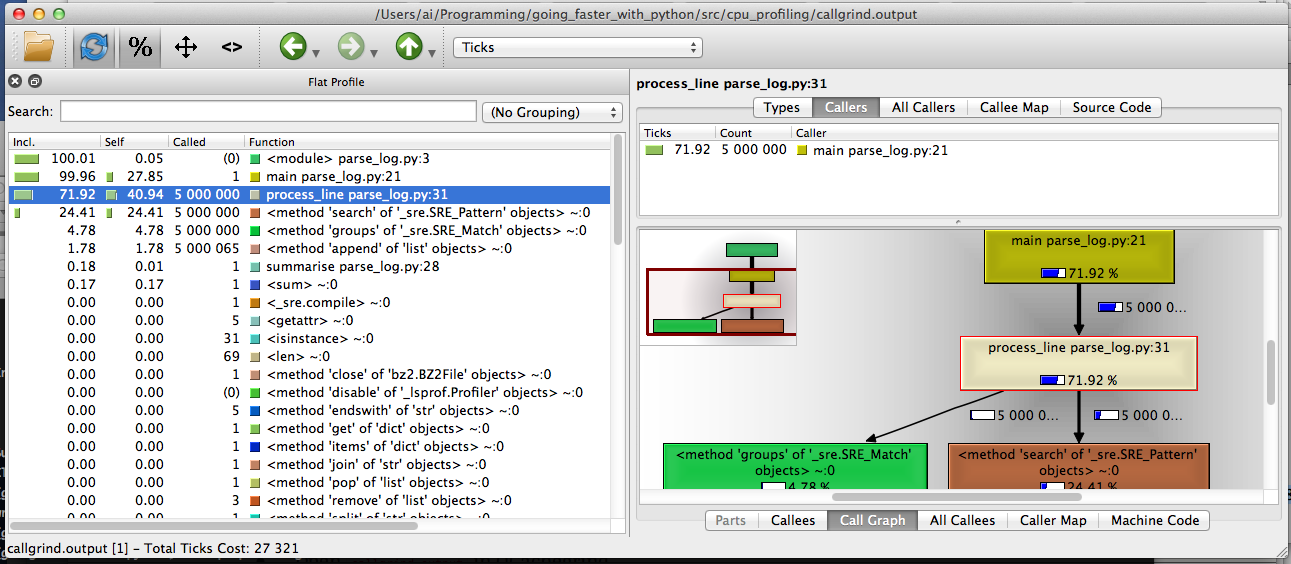
kcachegrind
- Download KCachegrind source, build QT GUI called
QCachegrind. - Generate a
cProfileoutput file, as before. -
pip install pyprof2calltree -
pyprof2calltree -i profile.stats -o callgrind.output - Open
callgrind.outputinQCachegrind
line_profiler
-
pip install line_profiler - Decorate functions of interest with
@profile - Run
kernprof.pywith arguments.
line_profiler
(going_faster_with_python)Mill:src ai$ kernprof.py -l -v cpu_profiling/parse_log_line_profiler.py

File: cpu_profiling/parse_log_line_profiler.py
Function: main at line 21
Total time: 105.217 s

Line #      Hits         Time  Per Hit   % Time  Line Contents
==============================================================
    21                                           @profile
    22                                           def main():
    23         1            2      2.0      0.0      cpu_usages = []
    24         1           34     34.0      0.0      with contextlib.closing(bz2.BZ2File(log_filepath)) as f_in:
    25   5000001     11602598      2.3     11.0          for line in f_in:
    26   5000000     93565103     18.7     88.9              process_line(line, cpu_usages)
    27         1        49088  49088.0      0.0      summarise(cpu_usages)
- Nothing surprising., but note total time 105s vs. 32s.
File: cpu_profiling/parse_log_line_profiler.py
Function: process_line at line 32
Total time: 44.2081 s

Line #      Hits         Time  Per Hit   % Time  Line Contents
==============================================================
    32                                           @profile
    33                                           def process_line(line, cpu_usages):
    34   5000000     14758591      3.0     33.4      re_obj = re_log_line.search(line)
    35   5000000      4406648      0.9     10.0      try:
    36   5000000      6765236      1.4     15.3          elems = re_obj.groups()
    37                                               except:
    38                                                   pass
    39                                               else:
    40   5000000      5814440      1.2     13.2          if elems[1] == "cpu_usage":
    41   5000000     12463137      2.5     28.2              cpu_usages.append(int(elems[2]))
-
trytakes up time, and line 41 is opaque
Contents
- What, why
- Time - where, how often
- Memory - how much, of what type
- Web frameworks
Memory
- Track OS memory usage using e.g.
psutil -
pympler, useful collection of modules -
memory_profilerjust likeline_profiler
# 01_tracker_namedtuple.py

import collections
from pympler import tracker

Point = collections.namedtuple("Point", ["x", "y"])
Line = collections.namedtuple("Line", ["line_number", "text"])

def get_point(i):
    return Point(i, i)

def get_line(i):
    return Line(i, "some random text" * 100)

def main():
    points = [get_point(i) for i in xrange(1000000)]
    lines = [get_line(i) for i in xrange(100000)]

if __name__ == "__main__":
    main()
Exercise - are slots worth it?
-
namedtuplesare a handy way to use__slots__. - Do these slot-less classes, with per-instance dicts, use more memory?
# 01_tracker_namedtuple.py
Point = collections.namedtuple("Point", ["x", "y"])
Line = collections.namedtuple("Line", ["line_number", "text"])

# 02_tracker_no_slots.py
class Point(object):
    def __init__(self, x, y):
        self.x = x
        self.y = y

class Line(object):
    def __init__(self, line_number, text):
        self.line_number = line_number
        self.text = text
OS memory usage
- Can use e.g.
psutilto get Resident Set Size (RSS) - Run script multiple times to rule out random error
-
measureproc.py: simple noddy script to do this
$ utilities/measureproc.py 03_memory/01_tracker_namedtuple.py
Summary of 5 runs
metric  | min    | Q1     | median | Q3     | max
--------+--------+--------+--------+--------+-------
clock   | 1.81   | 1.81   | 1.83   | 1.92   | 2.15
user    | 1.62   | 1.62   | 1.63   | 1.72   | 1.91
system  | 0.17   | 0.18   | 0.18   | 0.18   | 0.19
rss_max | 277.26 | 277.71 | 287.63 | 298.02 | 311.60

$ utilities/measureproc.py 03_memory/02_tracker_no_slots.py
Summary of 5 runs
metric  | min    | Q1     | median | Q3     | max
--------+--------+--------+--------+--------+-------
clock   | 2.50   | 2.59   | 2.62   | 2.65   | 2.79
user    | 2.08   | 2.13   | 2.19   | 2.23   | 2.32
system  | 0.32   | 0.36   | 0.37   | 0.38   | 0.41
rss_max | 588.88 | 605.69 | 607.55 | 607.69 | 608.93
pympler.tracker
-
pip install pympler - Using
pympler.tracker.SummaryTracker()is simplest. - Instantiate, run code, then call
print_diff().
from pympler import tracker

def main():
    tr = tracker.SummaryTracker()
    points = [get_point(i) for i in xrange(1000000)]
    lines = [get_line(i) for i in xrange(100000)]
    tr.print_diff()
pympler.tracker
$ 03_memory/01_tracker_namedtuple.py
                   types |   # objects |   total size
======================== | =========== | ============
                     str |      100968 |    156.17 MB
  <class '__main__.Point |     1000000 |     68.66 MB
                     int |     1099724 |     25.17 MB
                    list |         970 |      9.18 MB
   <class '__main__.Line |      100000 |      6.87 MB
                    dict |           1 |      1.02 KB

$ 03_memory/02_tracker_no_slots.py
                   types |   # objects |   total size
======================== | =========== | ============
  <class '__main__.Point |     1000000 |     61.04 MB
                    list |         970 |      9.18 MB
   <class '__main__.Line |      100000 |      6.10 MB
                     str |         970 |     54.26 KB
                     int |         122 |      2.86 KB
                    dict |           1 |      1.02 KB
pympler.class_tracker
- Can filter by classes with another
pymplermodule. - Note that it needs to use
weakref's, so can't tracknamedtuples- Something to do with using
__slots__? I'm not sure.
- Something to do with using
- Let's use it only on slot-less classes for now.
class Point(object):
    def __init__(self, x, y):
        self.x = x
        self.y = y

class Line(object):
    def __init__(self, line_number, text):
        self.line_number = line_number
        self.text = text

def main():
    tracker = ClassTracker()
    tracker.track_class(Point)
    tracker.track_class(Line)
    tracker.create_snapshot()

    points = [get_point(i) for i in xrange(100000)]
    lines = [get_line(i) for i in xrange(10000)]

    tracker.create_snapshot()
    tracker.stats.print_summary()
$ 03_memory/03_class_tracker.py
---- SUMMARY ------------------------------------------------------------------
                                         active      0     B      average   pct
  __main__.Line                               0      0     B      0     B    0%
  __main__.Point                              0      0     B      0     B    0%
                                         active      0     B      average   pct
  __main__.Line                           10000     19.14 MB      1.96 KB    0%
  __main__.Point                         100000     35.10 MB    368     B    1%
-------------------------------------------------------------------------------
memory_profiler
-
pip install memory_profiler - Decorate functions with
@profile, then run withmemory_profilermodule.- Just like
line_profiler.
- Just like
$ python -m memory_profiler 03_memory/04_memory_profiler.py
Filename: 03_memory/04_memory_profiler.py

Line #    Mem usage    Increment   Line Contents
================================================
    14                             @profile
    15     8.434 MB     0.000 MB   def main():
    16   231.766 MB   223.332 MB       lines = [get_line(i) for i in xrange(100000)]
    17   342.852 MB   111.086 MB       points = [get_point(i) for i in xrange(1000000)]
Contents
- What, why
- Time - where, how often
- Memory - how much, of what type
- Web frameworks
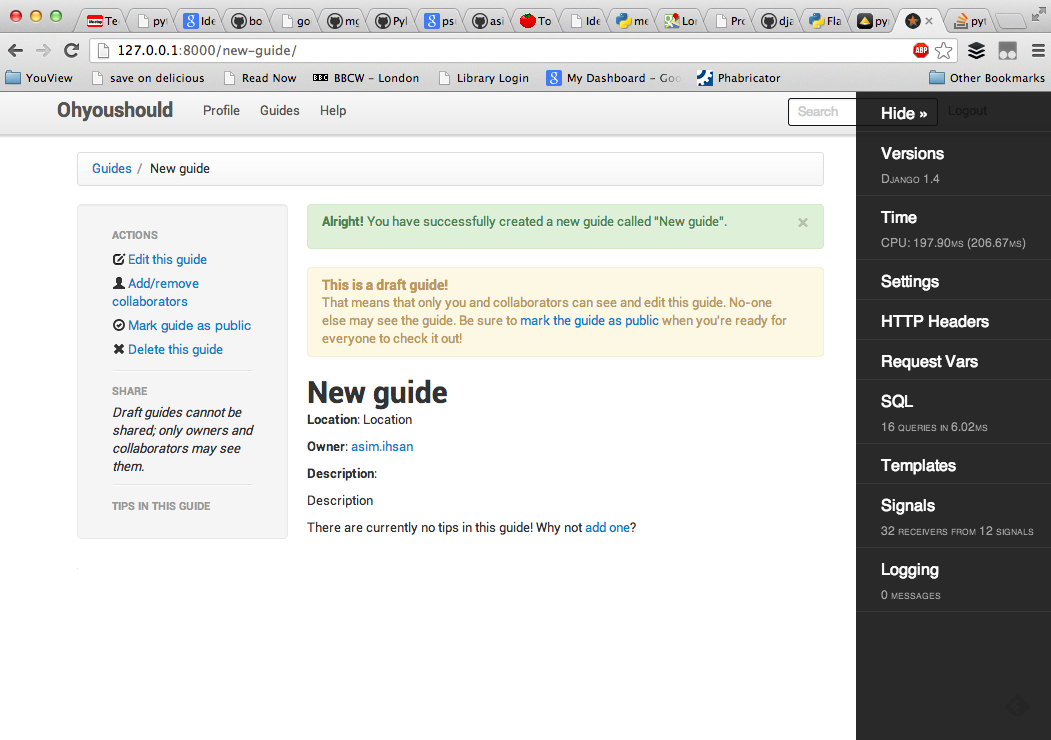
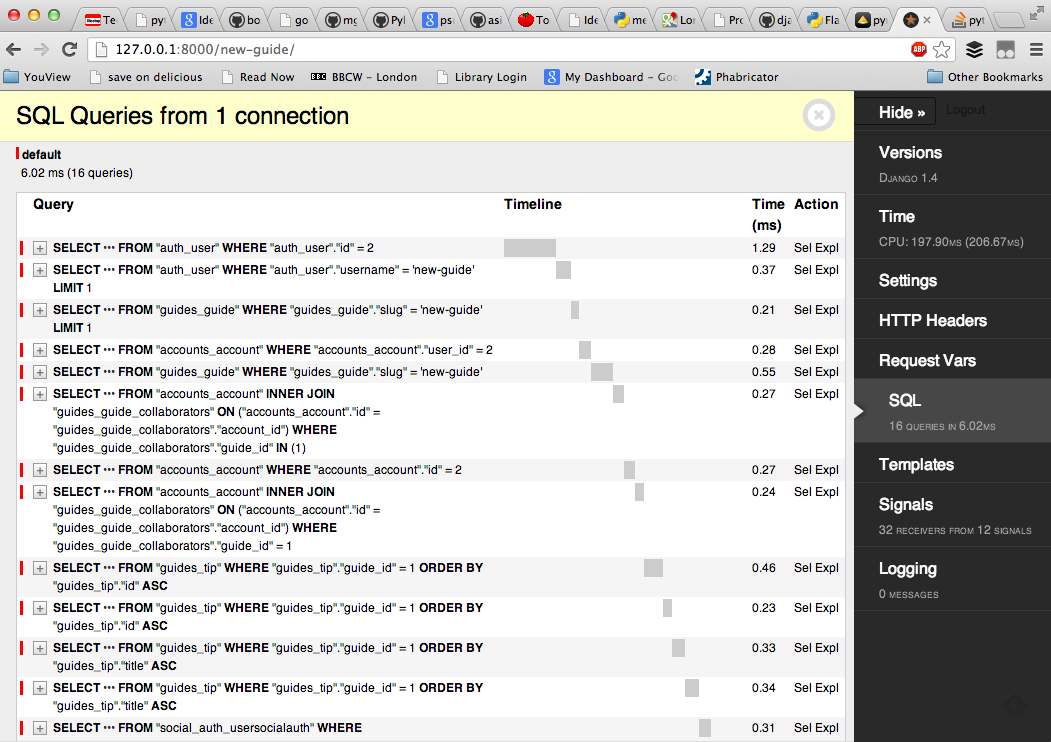
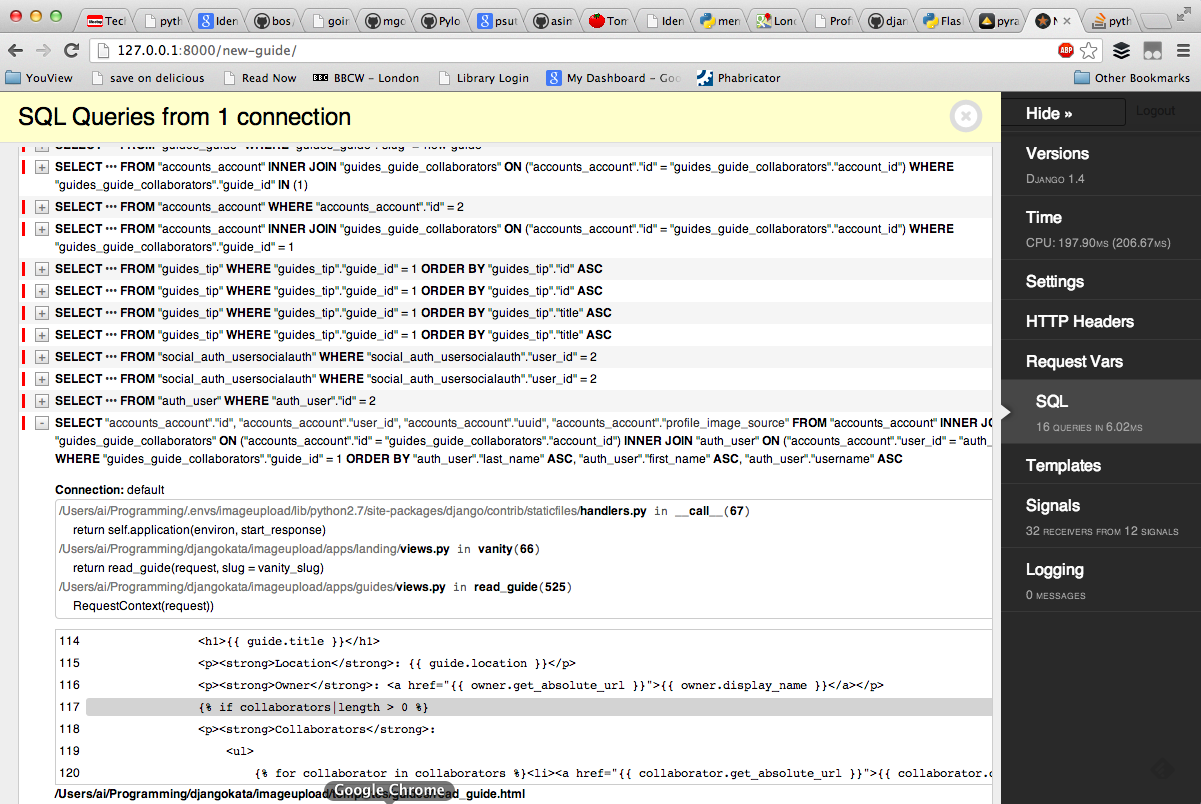
Web frameworks
-
debug-toolbaris awesome! - Originally for Django,
django-debug-toolbar- Clones available for Flask (
flask-debugtoolbar) and Pyramid (pyramid-debugtoolbar)
- Clones available for Flask (
All done
- GitHub repo for code: http://goo.gl/7V5Sv
- Copy of this presentation: http://goo.gl/qftdj
Thank you!